
Recordology
Now a guarantee in churning out statistics, Tennismylife wants to explain what is the logic behind the records. Given that numbers are now an integral part of the whole world of tennis, one may wonder what the “theory” behind these numbers is.
Everyone is able to understand and find more or less important statistics. Everyone knows about Connors’ famous 109 titles, even more than Federer’s 20 Slams, but how can we frame them better? Let’s take a step back (perhaps very long). Tennis is a sport that is played almost entirely in knockout tournaments and, in fact, in tournaments. This means that each tournament has x rounds and only the last one can assign the trophy. Another peculiarity of tennis is the presence of different surfaces: Hard, Clay, Grass, Carpet (until a few years ago). Then there are the categories: Slam, Masters 1000, ATP 500, ATP 250. All these elements divide the data into categories and sub-categories that can be a union and / or merge of the same. We can isolate the victories on clay and find its subset in the Slams, which specifically become the matches of Roland Garros and many other related examples. Following the example given at the beginning we can say that Connors’ 109 wins are part of the overall tournament wins and Federer’s 20 Slams are a subset of the same, i.e. those in which the data are filtered according to the category Slam.
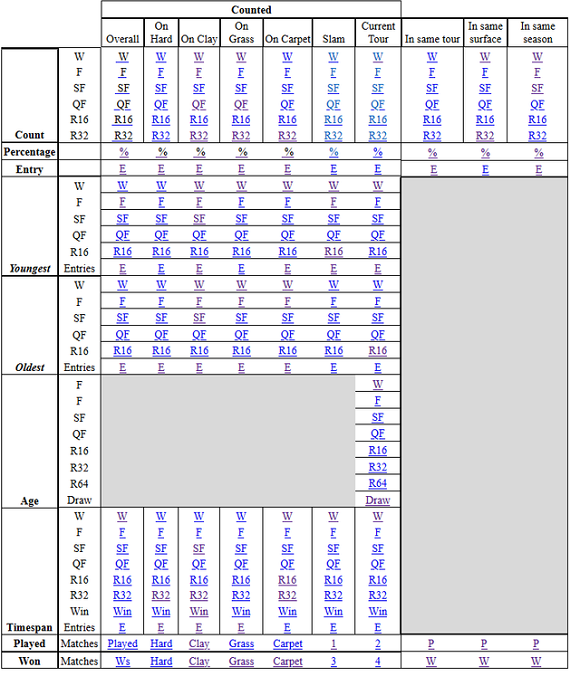
Statistics that for the unaccustomed can be so difficult, are easily framed. To simplify the work, they have been divided into the following rows:
Stats:
- Played
- Won
- Count
- Percentage
- Entry
- Youngest
- Oldest
- Average Age
- Timespan
Round: R128 – R64 – R32 – R16 – QF – SF – F – W
Categories: Overall – Surface – Level – Tournament
Number 1 refers to the games played. This is a “total” datum, that is, a datum that is not a subset of anyone. From it emerges the famous 1558 of Connors (which in the meantime could be changed), followed by the data concerning Federer’s matches (also constantly updated). From the statistics it is possible to extract a subset which can be that of the surface, or the category, or a tournament.
At number 2 there are the wins. This count concerns a subset of point 1, but was chosen as a stand-alone case because it is very distant from a conceptual point of view. Everyone wants to know the number of wins of a tennis player rather than the number of matches played by the same, that’s why the distinction.
The most substantial part concerns the number 3. The count-er. This is nothing more than the count of the shifts reached by a tennis player. These rounds range from R128 to F (final) to extend to victory (W) which is a special case of the final. This columns the results that merge with the data in line regarding surface, category and tournaments to create an M x N matrix where M is the number of rounds taken into consideration and N the subcategories.
At number 4 there is a very particular statistic that concerns the percentage. A very singular figure in tennis since at each tournament at most you can have only one defeat and several victories. This could concern all rounds, but it is better to isolate it only with categories, therefore only 4 statistics.
A particular statistic concerns Entries (number 5), these represent the number of participations of a tennis player that can concern a specific tournament, a category, or all tournaments in general.
An increasingly important role in the statistical survey concerns the ages of the players (number 6 and 7). A bit complex to derive and therefore directly entered in our database, they briefly concern the youngest or oldest to achieve an achievement. This section can cover both rounds and categories, so the same matrix is found for the Number 3 section. Youngest and Oldest are completely the same, what changes is the order: increasing in the first case, decreasing in the second.
A particular section is that of the aging age (number 8). While youngest and oldest give only 1 data, this calculates the average age. However, this only makes sense in a single tournament. It would make sense, as always, to extend it also to roudns and categories, but the data would lack consistency.
Another particular fact that is very fashionable today is the Timespan (number 9). It is a fundamental parameter for quantifying the longevity of a tennis player. This too is plotted following a matrix as in the case of Count, Youngest and Oldest.
Source Code
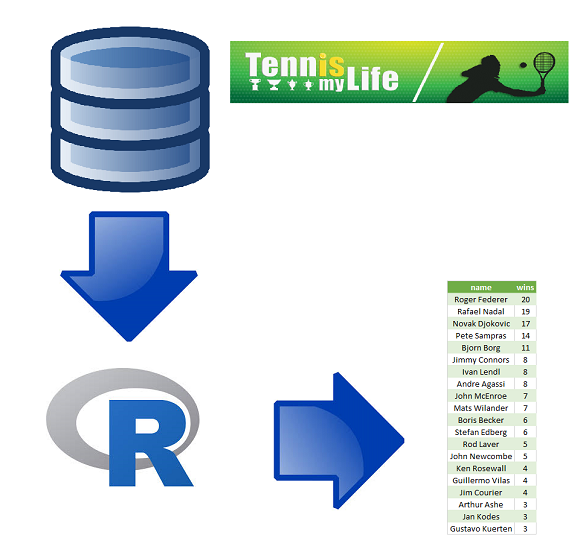
It seems everything easy, but now we need to calculate these statistics. Thanks to the R language, which seems made especially for us, a project has been developed that calculates everything necessary. The code can be downloaded from Github. Already in the folder there are HTML pages that display all the statistics. Starting, as usual, from Index.html, you can navigate through the hundreds of pages produced by the code in R. These aren’t automatically updated, however just run the Update.R script to get fresh numbers, thanks to the constantly updated TML Database live. The methods of the code can be used as an API for a possible Web App.

Additions
The code will always be updated and enriched with new methods that serve with a single method to find the data that interests us. The ultimate goal is to have a method for each statistic. At the moment, the “Same Tour” section has also been added, which deals with statistics regarding a specific tournament, such as: who has won multiple editions of the same tournament, who has more finals in the same tournament, who has more quarterfinals. And this is only the beginning guys!
After the successful pubblication of our Database, an article explaining the theory behind the tennis records, alias 'Recordology' 😉. And another surprise: the free ‼️ R open source code ‼️ to search for any record you want ‼️https://t.co/5P90jcg6nFhttps://t.co/hmJQC9cGUO pic.twitter.com/NFBDZnfT91
— TennisMyLife (@TennisMyLife68) February 24, 2020